3 Ways Visual Notes Promote Event Engagement for Meetings & Conferences
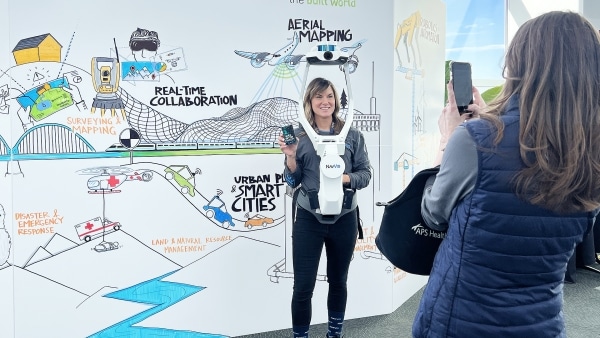
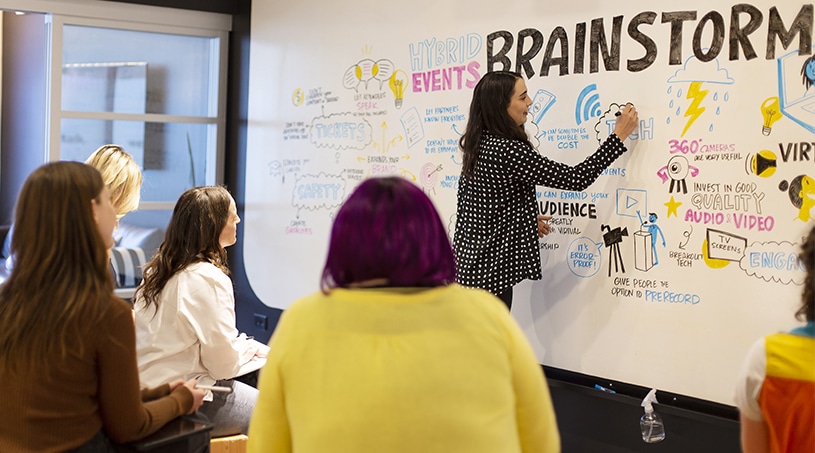
Hitting a wall finding new ideas to wake up tired audiences? Say hello to visual notes. No matter your format–virtual, in-person, or hybrid–visual notes can bump your event engagement from average to awesome. That’s because visuals have the power to keep people engaged and learning even after we burn out on listening and talking.
New to visual notes? The tool goes by many names–graphic recording, scribing, and sketch noting–and has been used by meeting facilitators since the 1990s. More recently, it has found its way into conferences, trade shows, and classrooms.
How does visual note-taking work?
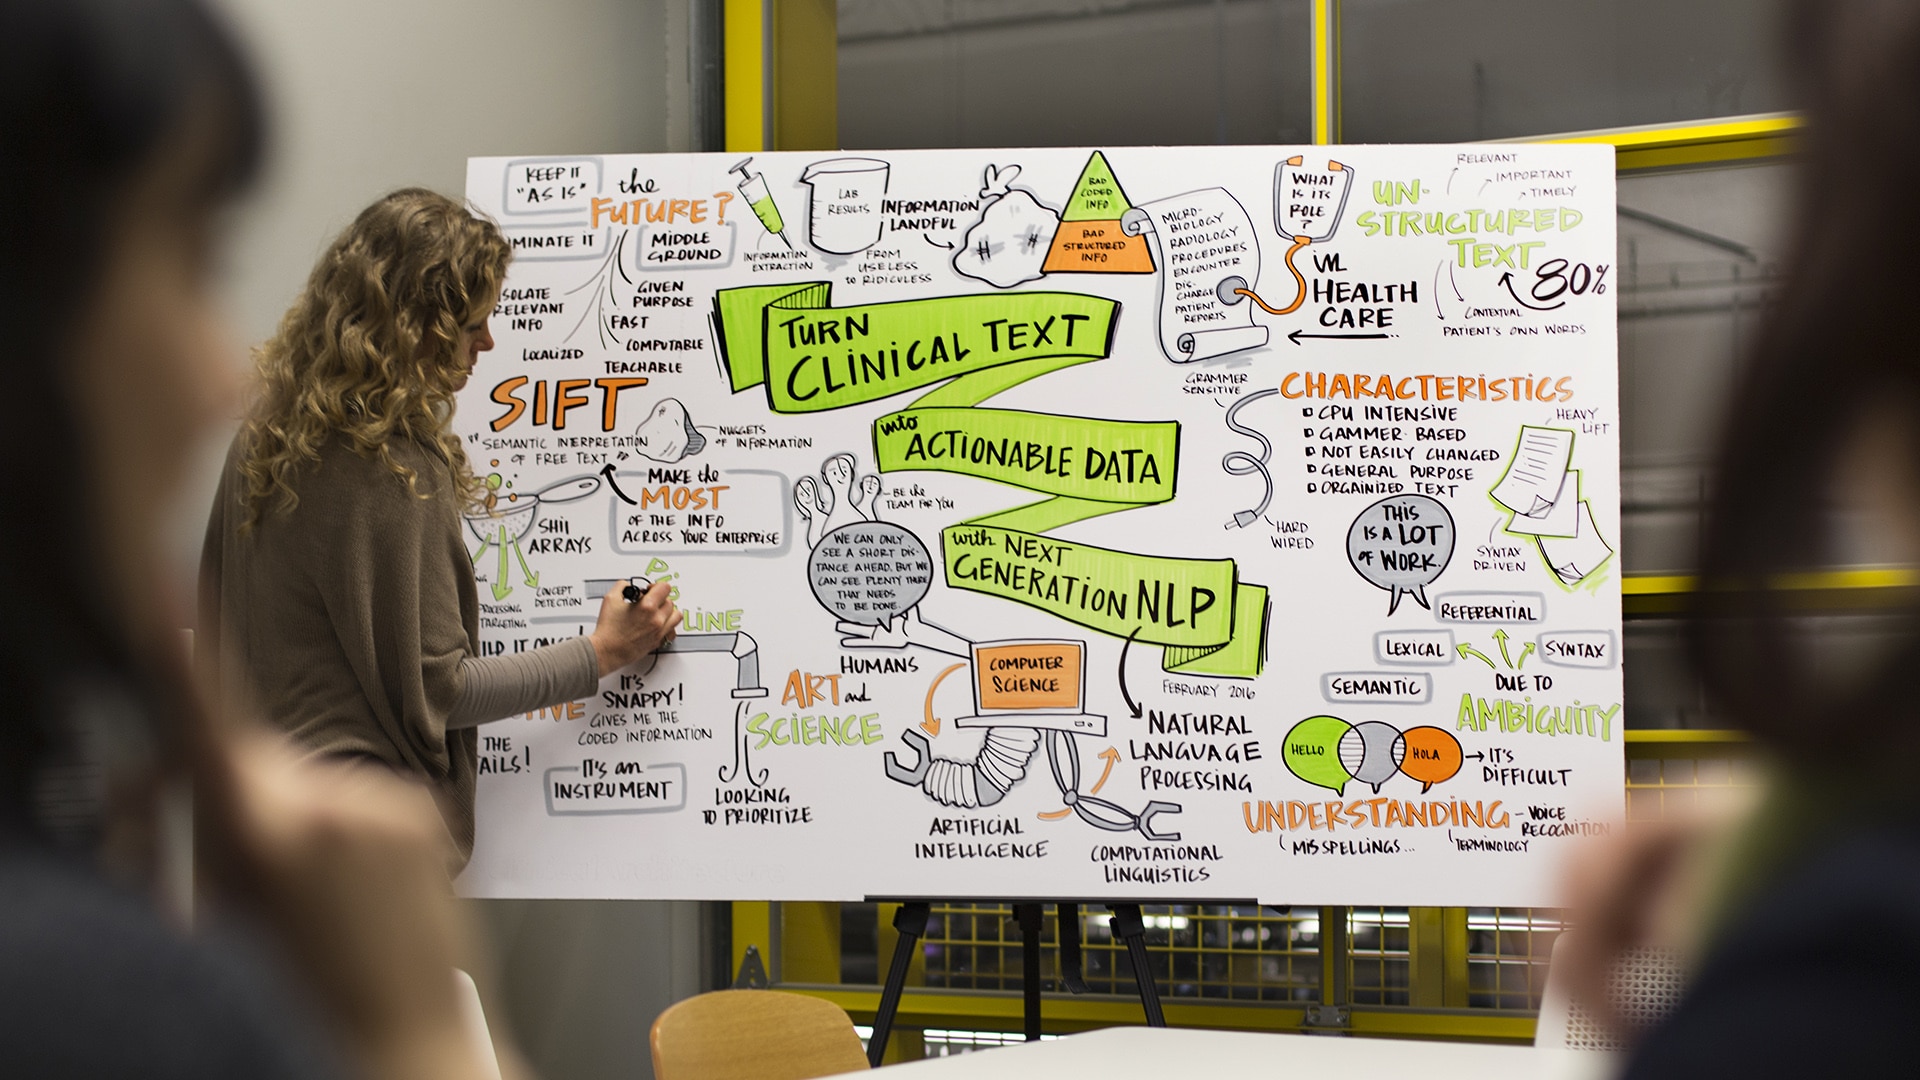
- The process of visual note-taking occurs in real-time and involves an artist:
- Actively listening to what is said.
- Filtering out extraneous information and identifying key concepts.
- Synthesizing these concepts by finding common themes and connections.
- Drawing these concepts, themes, and connections using illustrative text and visuals.
The science behind visuals (aka, why you need them at your event)
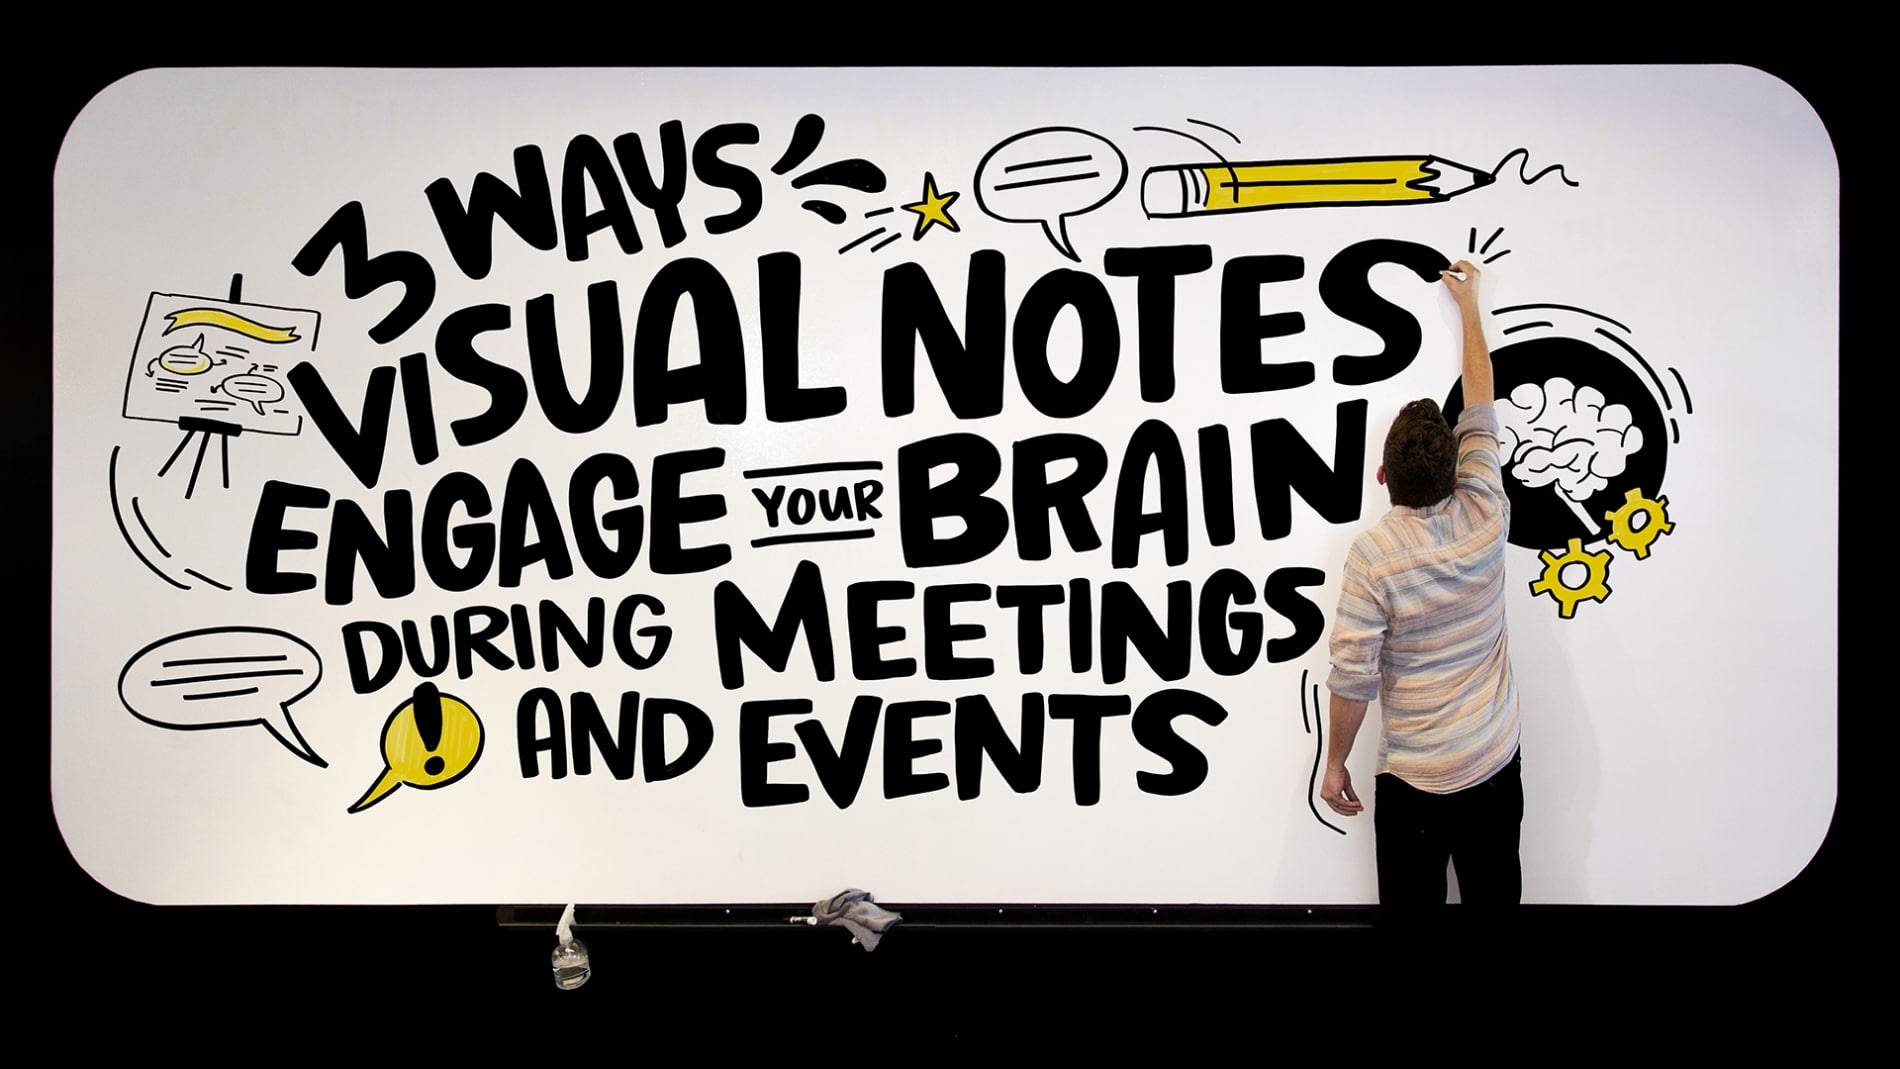
Visuals can positively influence how people process and remember information. Here are three ways visual notes engage your brain for the better during a meeting or event.
1. People process visuals better than words
Most people are visual learners. In fact, 65 percent of us learn better when pictures are involved (Yapton, 1998). Our brains were made to process pictures. 80 percent of the information we process every moment is visual and 20 percent of our brains are used purely for vision (Tate 2015). That visual system in our brain interacts with at least half of the rest of your brain; so taking notes using visuals is more attuned to the way our brains actually work.
65% of people learn better visually
Visual note-takers develop drawings that act as metaphors for the ideas behind the content–acting as “bookmarks” in your brain. When companies talk about growth, it can be drawn as a tree or growing plant. Innovation can be represented by a light bulb, and operations can be drawn as interlocking gears. Similar broad or abstract ideas are made more tangible when paired with a visual metaphor. When you associate an idea with an image, you’re more likely to remember and understand that concept.
Color visuals increase a person’s willingness to read by 80%
Visual note-taking also engages your audience’s emotions. Color in visual notes can also catch attention and trigger emotions that help people better engage with content. Having trouble getting people to pay attention to “boring” content? Researchers have found that color visuals increase a person’s willingness to read by 80 percent. (Green, 1989).
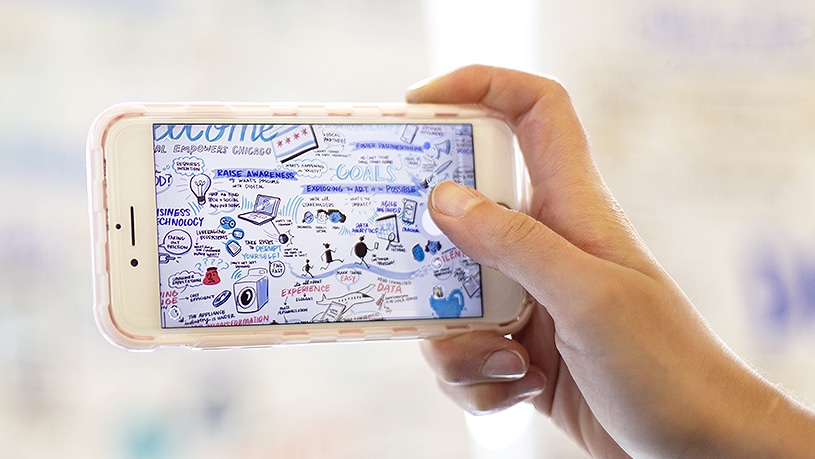
2. Visuals make events engaging because they make content more memorable
People “remember 80 percent of what they see and do, 10 percent of what they hear, and 20 percent of what they read” (Lester, 2006). Words are abstract and difficult for the brain to retain, but visuals are concrete and more easily remembered –a concept in psychology called the Picture Superiority Effect (Krum, 2014). So when you’re in a meeting discussing the goals for the future and strategy, and a visual note-taker draws symbols to represent those goals, they’re easier for the room to reference and ideate on.
And we’re not just talking about an increase in short-term recall–visuals stick in our long-term memory, unlike text. A study found that participants who viewed only text remembered 10 percent of what they read after three days. But those who viewed text paired with visuals remembered 65 percent of the information three days later (Medina, 2008).
Visuals are concrete and more easily remembered
Our ability to recall pictures is far better than our ability to recall words. In fact, “we can remember up to 2,000 pictures with only a little learning, and recognize them days later” (Tate 2015). Since visual notes summarize conversations with pictures, they make those conversations more memorable.
3. Visuals make content easier to understand
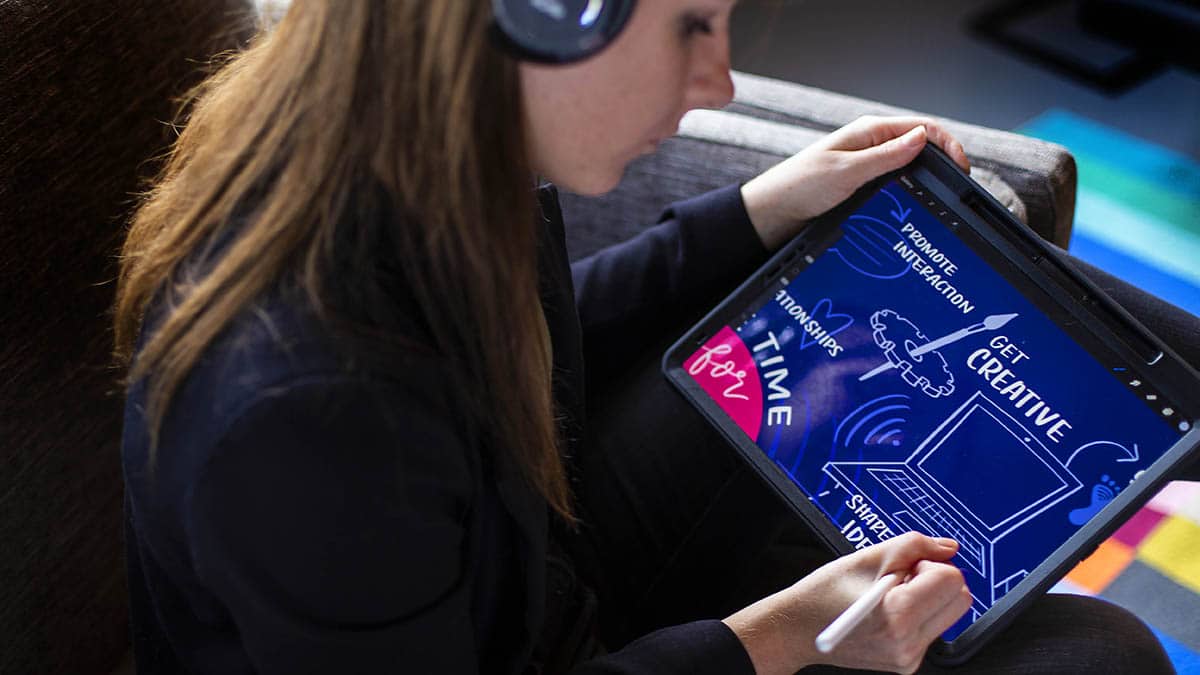
Fostering a true visual experience during your meetings and events creates a dramatic lift in participant engagement. We’ve seen it time and time again with all of our clients. Our eyes are constantly looking for concepts to latch onto–and we are much better at finding concepts in visuals than in text (Trafton, 2014). In fact, the brain processes visuals 60,000 times faster than text (Semetko & Scammell, 2012). That means when digital graphic recording is incorporated into a conference or meeting, most of the audience will be able to understand what’s being said more quickly.
Creating a more visual experience during meetings creates more ideas, creates better ideas, and increases recall, leading to better event engagement
Seeing content presented in a non-linear way can help audience members to more easily draw connections between information and concepts. Often, visual note-takers will intuitively draw physical connections (like arrows, lines, and paths) between related content, guiding the eye from point to point.
“These sorts of visuals are effective in brainstorming,” says Martin Eppler, professor of media and communication management at University of St. Gallen, Switzerland. “We’ve found in our experiments that using visuals during meetings creates more ideas, creates better ideas, and increases recall” (Averett, 2014).
Visual note-takers use color in strategic ways to help you understand and navigate content. Color is proven to improve readership by 40 percent, learning from 55 to 78 percent, and comprehension by 73 percent (Embey, Johnson, Colorcom).
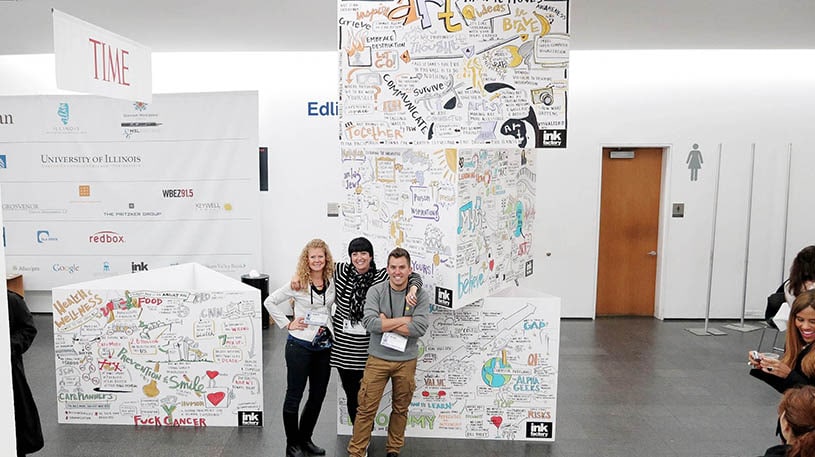
Visual Notes are the Answer to Information Overload
Want to increase event engagement? Simplify a complex process? Or strategize for effective action? Visual notes can help and our team of experienced artists is ready to draw your next event. Get in touch today to discuss how you can take advantage of the power of the visual experiences we create.
Wait, there’s more! Subscribe to the Ink Factory newsletter to learn the latest on visual trends.
With a community of 4,000+ visual thinkers, you’ll be in good company. Join us!
Sources
Andrade, J. (2010). What does doodling do? Applied Cognitive Psychology Appl. Cognit. Psychol., 24(1), 100-106. doi:10.1002/acp.1561
Averett, N. (2014, February). Science of the Creative Mind. Inc. Mag, 86-87.
“Business Papers in Color. Just a Shade Better”, Modern Office Technology, Colorcom, July 1989, Vol. 34, No. 7, pp. 98-102
Childers, P. B., Hobson, E., & Mullin, J. A. (1998). ARTiculating: Teaching writing in a visual world. Portsmouth, NH: Boynton/Cook.
Embry, David, “The Persuasive Properties of Color”, Marketing Communications, October 1984.
Green, R. (1989). The Persuasive Properties of Color. Marketing Communications. Retrieved August 31, 2016, from http://www.office.xerox.com/latest/COLFS-02UA.PDF
Ink on Paper: Some Notes on Note Taking. (2014, January 28). Retrieved August 30, 2016, from http://www.psychologicalscience.org/index.php/news/were-only-human/ink-on-paper-some-notes-on-note-taking.html
Johnson, Virginia, “The Power of Color”, Successful Meetings, June 1992, Vol 41, No. 7, pp. 87, 90.
Konnikova, M. (2014, June 2). What’s Lost as Handwriting Fades. The New York Times.
Krum, Randy. Cool Infographic : Effective Communication with Data Visualization and Design. Indianapolis, Indiana: Wiley, 2014. Print.
Lester, P. M., Ph.D. (2006). Syntactic Theory of Visual Communication. Retrieved August 30, 2016, from https://blog.kareldonk.com/wp-content/uploads/2015/03/SyntacticTheoryofVisualCommunication.pdf
Levie, W.H. & Lentz, R. ECTJ (1982) 30: 195. doi:10.1007/BF02765184
Manktelow J. Yapton, (1998) England: Mind Tools, Ltd.
Medina, J. (2014). Brain rules: 12 principles for surviving and thriving at work, home and school. Seattle, WA: Pear Press.
Mousavi, Seyed Yaghoub, Renae Low, and John Sweller. “Reducing Cognitive Load by Mixing Auditory and Visual Presentation Modes.” Journal of Educational Psychology 87.2 (1995): 319-34. Web.
Tate, Andrew. “10 Scientific Reasons People Are Wired To Respond To Your Visual Marketing.” Design School. Canva, 19 May 2015. Web. 16 May 2017.
Scammell, Margaret, and Holli Semetko. SAGE Handbook of Political Communication. London: SAGE Publications, 2012. Print.
Schott, G. (2011). Doodling and the default network of the brain. The Lancet, 378(9797), 1133-1134. doi:10.1016/s0140-6736(11)61496-7
Udomon, I., Xiong, C., Berns, R., Best, K., & Vike, N. (2013). Visual, Audio and Kinesthetic Effects on Memory Retention and Recall. Journal of Advanced Student Science. Retrieved August 31, 2016.
Zacks, J., Tversky, B., & Schiano, D. (2002). Graphs in Print. Diagrammatic Representation and Reasoning, 187-206. Retrieved August 31, 2016, from Springer Link.