
The Powerful Science Behind Visual Note-Taking
At Ink Factory, we use the term “visual note-taking” to describe our work: real-time note-taking comprised of hand-drawn images and text. Visual note-taking is a form of visual communication that’s perfect for live events like meetings, webinars, keynote speeches, presentations, and much more. Both viewers of visual notes and visual note-takers themselves can benefit from this live drawing by boosting their ability to process, retain, and recall information. That “mental boost” comes from the visual aspect of visual note-taking. In fact, visuals are a proven way to increase engagement with content, improve information retention and understanding, and more.

What is Visual Note-taking?
Visual notes are drawings that use a combination of text and imagery to convey key points from presentations, meetings, class lectures, or anything, really.
Visual notes are created in real-time while actively listening to content. They are typically drawn using pen and marker and can also be drawn digitally. Their composition is non-linear.
Visual notes are not drawn left to right and top-down like traditional notes. They are developed by making connections between content. They use illustration as well as handwritten text to communicate information and represent concepts. This combination of text and simple illustrations create simple “bookmarks” in the brain.

Visual Note-Taking Influences Audiences
In a world where PowerPoint presentations are considered too wordy, audiences are looking for easier ways to digest information. Well-designed visuals help viewers more easily understand information. The process of drawing by hand in real-time further drives engagement–people are captivated by watching visual note-takers work!

Visual Note-taking Has Power
Visual information “has increased 400% in literature, 9900% on the internet, and 142% in newspapers.” (Zacks, 2002). Combining visuals with text is simply more engaging! Researchers have found that color visuals increase a person’s willingness to read by 80 percent (Green, 1989). That’s probably because sixty-five percent of people simply learn better visually (Yapton, 1998).

Visual Note-taking Helps People Remember Your Content
When combined with the audio of a presentation or speech, visuals have a powerful impact on memory. Graduate students at the University of Wisconsin-Madison found that visuals are more effective than audio at achieving higher memory retention. Specifically, it seems that the use of visuals with text is easiest to remember (Udomon, et al., 2013).
“Words are difficult for the brain to retain. Visuals are concrete and more easily remembered.”
People “remember 80 percent of what they see, 10 percent of what they hear, and 20 percent of what they read” (Lester, 2006). Words are abstract and difficult for the brain to retain. Visuals are concrete and more easily remembered. This concept in psychology is called the Picture Superiority Effect.

We’re not just talking about an increase in short-term recall. Visuals stick in our long-term memory, unlike text. A study found that participants who viewed only text remembered 10 percent of what they read after three days. Those who viewed text paired with visuals remembered 65 percent of the information three days later (Medina, 2008).
Want to make sure your ideas aren’t forgotten after one event? Or encourage your team to sustain momentum after a strategy meeting? Use visuals!
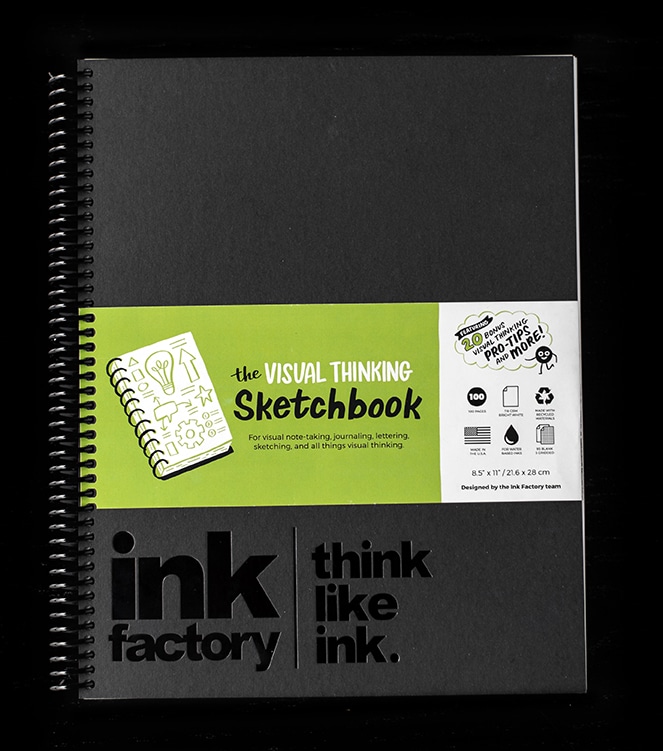
The Visual Thinking Sketchbook
Visual Note-taking Improves Comprehension
Our eyes are constantly looking for concepts to latch onto–and we are much better at finding concepts in visuals than in text (Trafton, 2014). In fact, the brain processes visuals 60,000 times faster than text (Semetko & Scammell, 2012). When visual notes are used in a conference or meeting, many of the viewers will be able to more quickly understand the content over content presented without visuals.
“Using visuals during meetings creates more ideas, creates better ideas, and increases recall.”
Seeing content presented in visually helps people to connect ideas. Visual note-takers draw physical connections (like arrows, lines, and paths) between related content to guide the viewer’s eye around the page. “These sorts of visuals are effective in brainstorming,” says Martin Eppler. “We’ve found in our experiments that using visuals during meetings creates more ideas, creates better ideas, and increases recall” (Averett, 2014).

One study explored the way people interpret instructions on medicine packaging. Researchers found that people following directions with text and illustrations did much better than those following text-only directions (Levie & Lentz, 1982). We often rely on visuals to process information, so picking up a marker and communicating with a visual language is intuitive to many people.
YOU should start taking visual notes!
Visual note-taking is similar to traditional note-taking: anyone can do it regardless of his or her drawing ability. And there’s no pressure when you’re learning to take your own visual notes: no one else will see them and they serve as great reference material.

Visual note-taking goes beyond pretty pictures. It’s a tool anyone can use to improve their ability to retain information. Unlike traditional visual art forms, there is no pressure to make beautiful images.
When you start utilizing visual notes, you start to process and reframe information in your own language. This leads to better information retention. In a study completed by Princeton and UCLA, professors discovered that students who took handwritten notes did better with memory recall than students who took notes with their laptops (Herbert, 2014).
“When you start taking visual notes you start to process and reframe information in your own language.”
Research suggests that even the simple act of doodling can help assuage boredom, keeping the brain from entering a daydreaming or “idling mode,” which helps individuals stay focused during an otherwise stimulating activity (Schott, 2011).

Previously maligned as a sign that students aren’t paying attention in class, a study found that a group who doodled during a monitoring task recalled 29 percent more information than the non-doodlers (Andrade, 2009).
“A group who doodled during a monitoring task recalled 29 percent more information than the non-doodlers.”
Letters themselves are a visual means of communication. Early language started with pictures. Combining words with illustrations is a great way to communicate with others (Childers et al., 2013). When you consider the origins of visual language and communication, taking visual notes makes sense!
Learn visual note-taking with Ink Factory
Interested in learning how to become a visual note-taker? We host full-day workshops that are a deep-dive into the fundamental skills behind taking visual notes. Our public workshops are now available on-demand!

Wait, there’s more! Subscribe to the Ink Factory newsletter to learn the latest on visual trends.
With a community of 4,000+ visual thinkers, you’ll be in good company. Join us!
Sources
Andrade, J. (2010). What does doodling do? Applied Cognitive Psychology Appl. Cognit. Psychol., 24(1), 100-106. doi:10.1002/acp.1561
Averett, N. (2014, February). Science of the Creative Mind. Inc. Mag, 86-87.
Childers, P. B., Hobson, E., & Mullin, J. A. (1998). ARTiculating: Teaching writing in a visual world. Portsmouth, NH: Boynton/Cook.
Green, R. (1989). The Persuasive Properties of Color. Marketing Communications. Retrieved August 31, 2016, from http://www.office.xerox.com/latest/COLFS-02UA.PDF
Ink on Paper: Some Notes on Note Taking. (2014, January 28). Retrieved August 30, 2016, from http://www.psychologicalscience.org/index.php/news/were-only-human/ink-on-paper-some-notes-on-note-taking.html
Konnikova, M. (2014, June 2). What’s Lost as Handwriting Fades. The New York Times.
Lester, P. M., Ph.D. (2006). Syntactic Theory of Visual Communication. Retrieved August 30, 2016, from https://blog.kareldonk.com/wp-content/uploads/2015/03/SyntacticTheoryofVisualCommunication.pdf
Levie, W.H. & Lentz, R. ECTJ (1982) 30: 195. doi:10.1007/BF02765184
Manktelow J. Yapton, (1998) England: Mind Tools, Ltd.
Medina, J. (2014). Brain rules: 12 principles for surviving and thriving at work, home and school. Seattle, WA: Pear Press.
Mousavi, Seyed Yaghoub, Renae Low, and John Sweller. “Reducing Cognitive Load by Mixing Auditory and Visual Presentation Modes.” Journal of Educational Psychology 87.2 (1995): 319-34. Web.
Scammell, Margaret, and Holli Semetko. SAGE Handbook of Political Communication. London: SAGE Publications, 2012. Print.
Schott, G. (2011). Doodling and the default network of the brain. The Lancet, 378(9797), 1133-1134. doi:10.1016/s0140-6736(11)61496-7
Udomon, I., Xiong, C., Berns, R., Best, K., & Vike, N. (2013). Visual, Audio and Kinesthetic Effects on Memory Retention and Recall. Journal of Advanced Student Science. Retrieved August 31, 2016.
Zacks, J., Tversky, B., & Schiano, D. (2002). Graphs in Print. Diagrammatic Representation and Reasoning, 187-206. Retrieved August 31, 2016, from Springer Link.

